The % of children age 0-6 above the National Average of LEAD in their
bloodstream, ( that's 5 micrograms/deciliter )
Note that Flint is only 5% . Reuters found nearly 3,000 areas with lead
poisoning rates at least double those in Flint. And more than 1,100 of these had
a rate of elevated lead in the bloodstream at least four times higher.
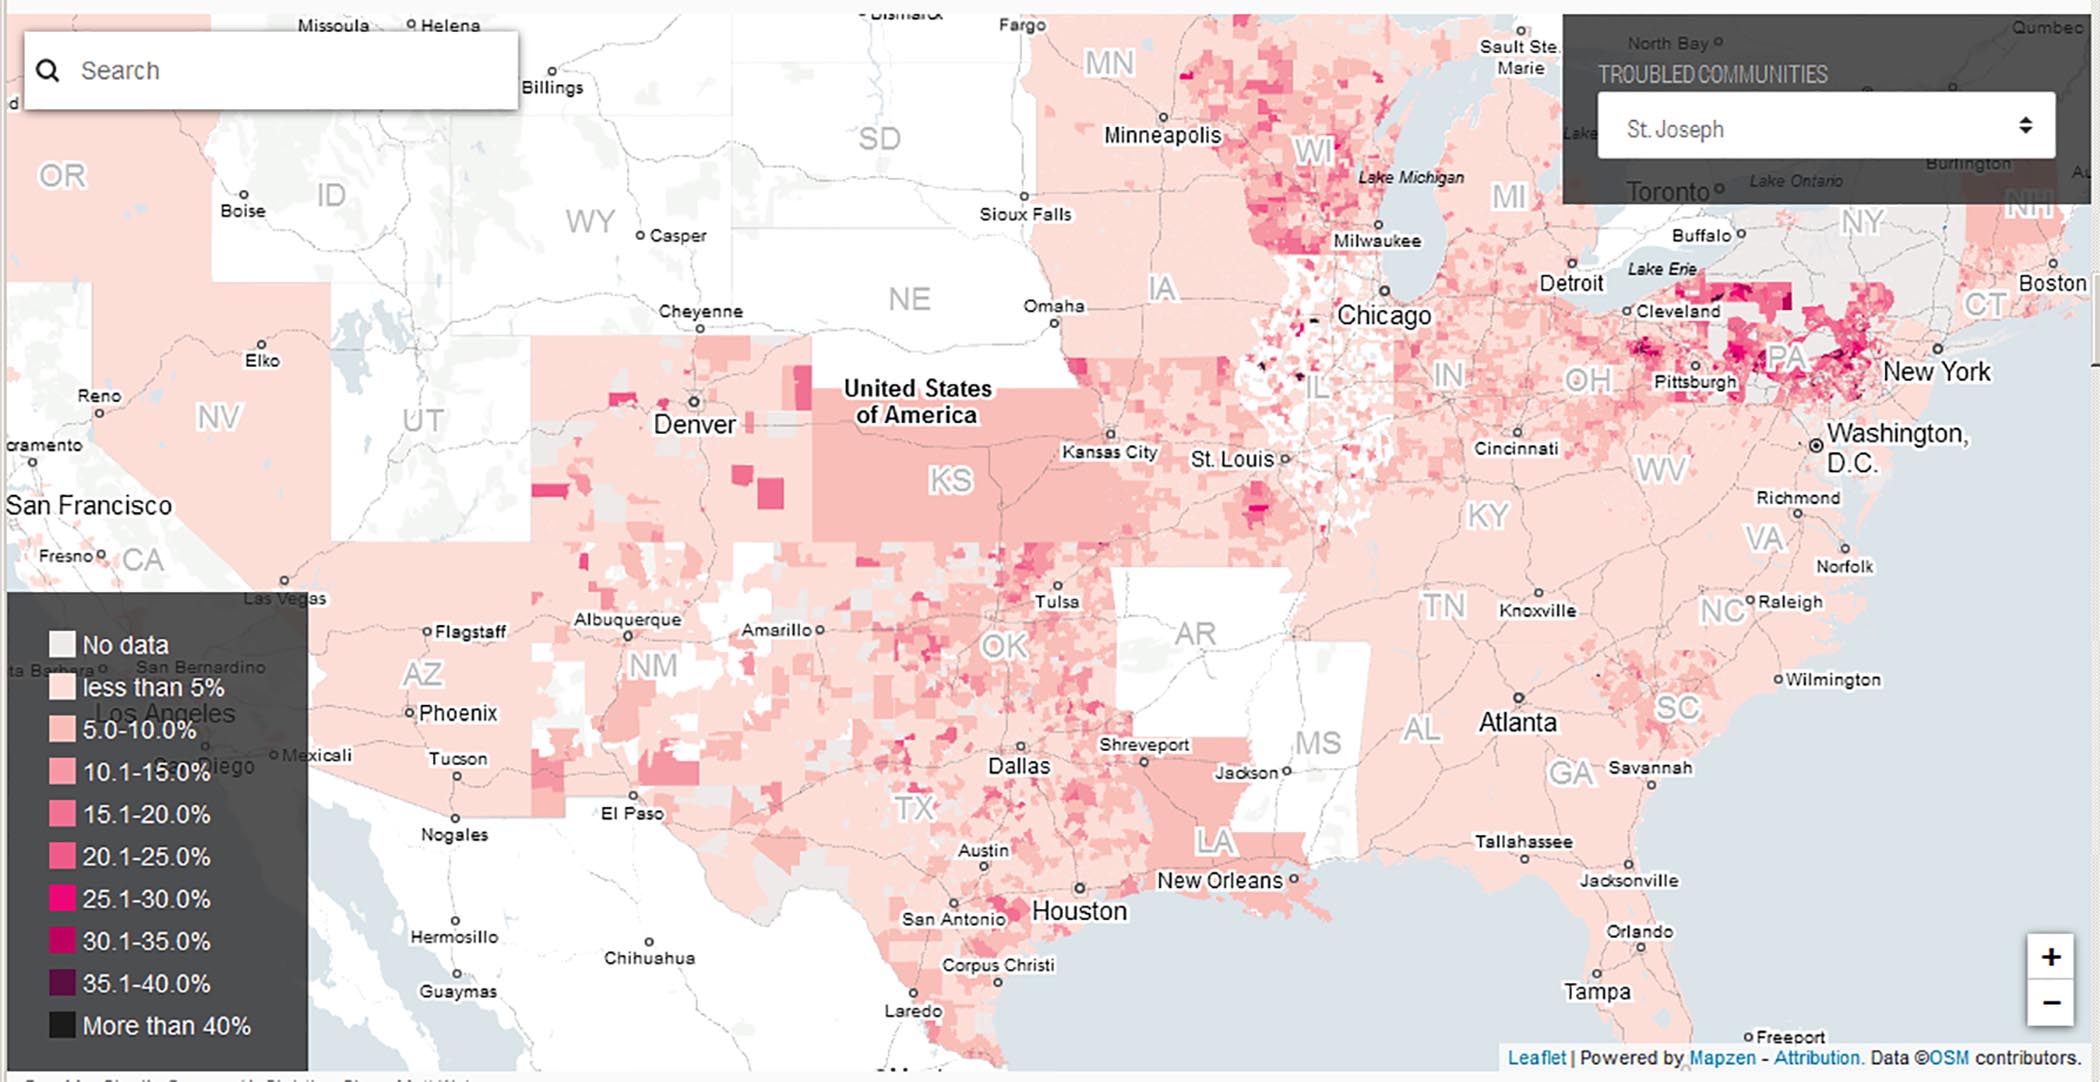
Mostly from paint, plumbing, yards, well-water or even playgrounds. Children
in at least 4 million U.S. households are exposed to high levels of lead, the
CDC says. One-in-five cases of ADHD may be linked to lead poisoning, a recent
American Academy of Pediatrics report concluded.
source Reuters
Source: State agencies or CDC. Some
states did not include data for census tracts and zip codes if the testing
numbers were small, usually below five, to protect patient privacy. These areas
appear as if no one was tested.
Data by census tract: CO, IN, MA, MD, MN, MO, NY, WI, PA, OH
Data by zip code: CA, IL, MI, NM, OK, RI, SC, TX, WV, CT, IA
Years: Data for 2012: CA, 2015: IL, NH; 2005-2011: TX;
2005-2015: IN, MA, MD, PA, NY, OH, MI, OK, RI, WV, CT; 2006-2015: NM, IA;
2010-2014: CO, WI; 2010-2015: AL, AZ, DE, GA, KY, LA, MO, NC, NJ, NV, OR, SC,
TN, VT; 2011-2015: MN; 2014 DC; 2010-2012: FL, KS, WA; 2010-2011: VA.
Result types: TX, WC, CT, IA, MO, MN only included confirmed
results, MA included estimated confirmed results and all other states included a
mix of confirmed and unconfirmed test results.
NOTES
• All the states included children tested under the age of six except Indiana,
which included children under seven.
• California could only provide results for 200 zip codes with the highest
number of children under age 6 years who had lead levels at or above 4.5
micrograms per deciliter and where at least 500 children were tested.
• New York data from the CDC is generally limited to the period between
2005-2007, though there are a few records from 2015.
• Iowa was only able to provide data on numbers of children who tested above 10
micrograms per deciliter.
• Massachusetts uses confirmed and unconfirmed results to estimate the number of
children with elevated lead levels.
• Wisconsin’s numbers represent the percentage of children who tested with blood
lead levels between 5 to 9.9 micrograms per deciliter. In addition, Wisconsin
offered separate figures for children with highly elevated levels above 10
micrograms per deciliter, which are not included here. In some of the most
heavily impacted census tracts in the state, 10 percent or more of blood tests
came back at a 10 or higher.