Will the WOMEN'S MARCH fizzle like OCCUPY WALL STREET?
Is protest broken? Disruptive tactics have
failed to halt the rise of Donald Trump.
Movements ranging from Black Lives Matter to
Environmentalism are leaving activists
frustrated.
Meanwhile, recent years have witnessed the largest protests in human
history. Yet these mass mobilizations no longer change society.
Now activism is at a crossroads: innovation or
irrelevance. Read
END OF PROTEST
|
|
Here's a MODEL FOR
ACTION :-
One representative from the Sierra Club acted
as a catalyst and facilitator to inspire local action against a Coal
Polluter.
YEARS OF
LIVING DANGEROUSLY
We must train leaders to go to the FRONT LINES
( in SWING STATES ) |
|
Manchin the Grinch |
| |
|
Here's a Parody Ad – that ran
on Fox News –that Turns
Trump Campaign Rhetoric on Its Head --
(Scheduled to run between 7 a.m. and 7:30 a.m. EST during
“Fox & Friends,” the AD likely was seen by millions of
Republican Voters) |
How can we reach Trump supporters when
84% of Republicans get their news
from Fox News ? |
|
|
| |
|
When the Republicans took power in 2004 the first thing they
did was to reward the Banks (who had financed
their election) with a Bankruptcy Bill --
(to allow banks to hound you till your death if you don't file for
Bankruptcy by selling your house first).
Were there any ADs on TV in the
Swing States telling voters of this ? No!
Don't wait till 3 months before the next election.
|
How do we show
Republicans in these Swing States these repressive Bills and acts in Congress (and Committee),
that are
against their interest, -- as they happen!
And don't wait till 3 months before the Election. |
|
|
| |
|
Somebody needs to be continually
rebutting FOX LIES.
Republican Voters are not watching MSNBC
so it needs to be TV ADS in
Swing States especially! |
More than
a how-to manual for organizers, NO SHORTCUTS is how to build working-class power.
A dozen case studies of Unions and Social Movements seeking to effect change |
|
Ralph Nadar has the PLAN -- the book: "Action
for a Change " |
| |
|
|
| |
|
Some supporters of
President Donald Trump believe just about everything he says, even when he’s
wrong. And Trump himself seems to have absolute confidence in his own
beliefs ? again, even when he is demonstrably wrong.
But there is a
psychology lesson that could help explain it, according to Cambridge
University-educated actor Stephen Fry, who was voted the most intelligent
person on TV in the United Kingdom.
For example, researchers found students who were least proficient often
overestimated their own abilities.
“The skills they lacked were the same skills required to recognize their
incompetence,” Fry said. “The incompetent are often blessed with an
inappropriate confidence buoyed by something that feels to them like
knowledge.”
That’s now known as the Dunning-Kruger effect.
In a new clip that Pindex put together, Fry also explains how Salience Bias
and the power of repetition help shape views more than facts.
“The greatest enemy of knowledge is not
ignorance,” Fry says in the clip.
“It is the illusion of knowledge.”
|
| |
|
|
115th Congress Members Guide with Elections and Demographic Data by District
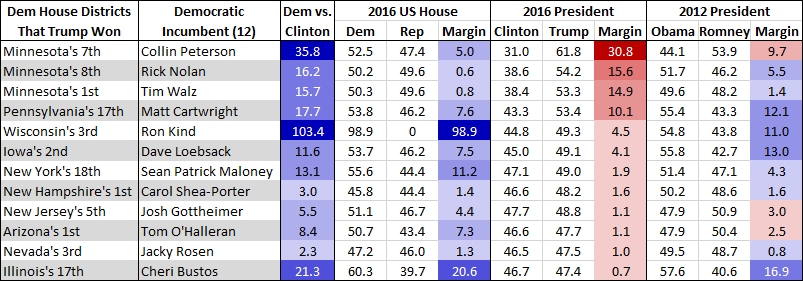
Democrats need to win 24 seats to take control of the House in 2018 and
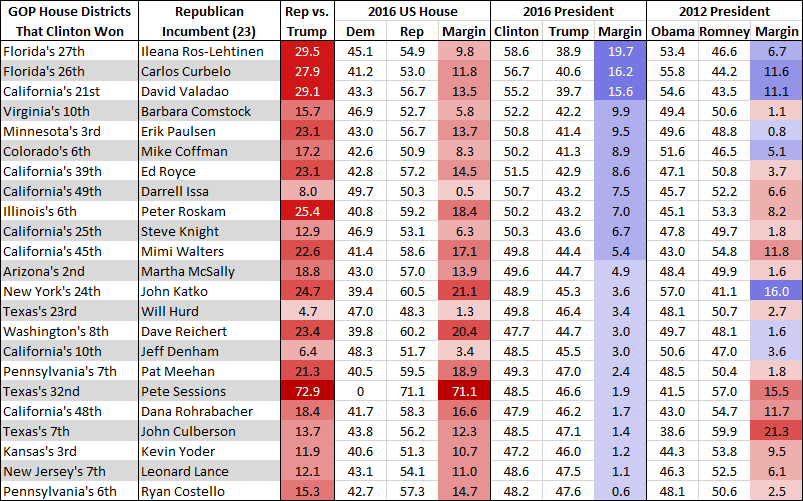
defend 12 seats in districts that Trump carried.
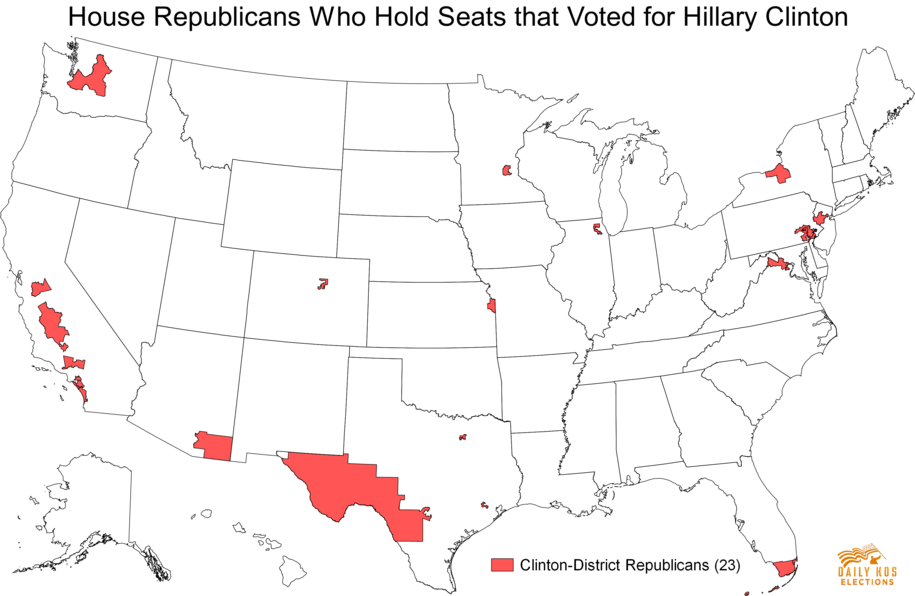
House Republicans who hold seats that voted for Hillary Clinton
| Florida's |
27th |
Ileana Ros-Lehtinen |
| Florida's |
26th |
Carlos Curbelo |
| California's |
21st |
David Valadao |
| Virginia's |
10th |
Barbara Comstock |
| Minnesota's |
3rd |
Erik Paulsen |
| Colorado's |
6th |
Mike Coffman |
| California's |
39th |
Ed Royce |
| California's |
49th |
Darrell Issa |
| Illinois's |
6th |
Peter Roskam |
| California's |
25th |
Steve Knight |
| California's |
45th |
Mimi Walters |
| Arizona's |
2nd |
Martha McSally |
| New York's |
24th |
John Katko |
| Texas's |
23rd |
Will Hurd |
| Washington's |
8th |
Dave Reichert |
| California's |
10th |
Jeff Denham |
| Pennsylvania's |
7th |
Pat Meehan |
| Texas's |
32nd |
Pete Sessions |
| California's |
48th |
Dana Rohrabacher |
| Texas's |
7th |
John Culberson |
| Kansas's |
3rd |
Kevin Yoder |
| New Jersey's |
7th |
Leonard Lance |
| Pennsylvania's |
6th |
Ryan Costello |
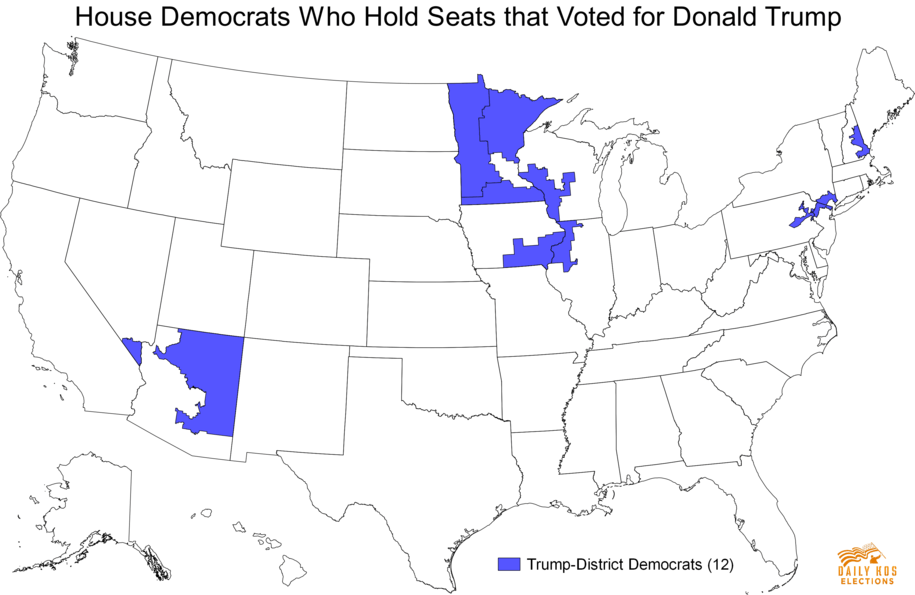
House
Democrats who hold seats that voted for Trump
|
| Minnesota's |
7th |
Collin Peterson |
| Minnesota's |
8th |
Rick Nolan |
| Minnesota's |
1st |
Tim Walz |
| Pennsylvania's |
17th |
Matt Cartwright |
| Wisconsin's |
3rd |
Ron Kind |
| Iowa's |
2nd |
Dave Loebsack |
| New York's |
18th |
Sean Patrick Maloney |
| New Hampshire's |
1st |
Carol Shea-Porter |
| New Jersey's |
5th |
Josh Gottheimer |
| Arizona's |
1st |
Tom O'Halleran |
| Nevada's |
3rd |
Jacky Rosen |
| Illinois's |
17th |
Cheri Bustos |
65 Swing Districts
|
State |
District |
Category |
Median income (dollars) |
Unemployment: All 16+ year olds |
Non-Hispanic White VAP % |
Black VAP % |
Hispanic VAP % |
Asian VAP % |
Foreign-born rate |
Language other than English at home |
Less than 9th grade |
High school graduate (includes equivalency) |
Some college, no degree |
Bachelor's degree |
Bachelor's Plus |
| Oregon |
4 |
Left Behind |
$43,138 |
10.4% |
87.1% |
0.8% |
5.8% |
2.4% |
5.3% |
7.7% |
2.7% |
27.2% |
29.0% |
15.4% |
25.3% |
| Maine |
2 |
Left Behind |
$43,404 |
7.9% |
95.5% |
0.6% |
1.0% |
0.7% |
2.7% |
6.5% |
3.6% |
37.6% |
20.3% |
14.5% |
22.2% |
| Illinois |
17 |
Left Behind |
$44,116 |
9.3% |
80.4% |
10.1% |
7.1% |
1.2% |
5.0% |
8.9% |
4.2% |
35.5% |
24.3% |
12.0% |
17.9% |
| California |
36 |
Diverse, Fast-Growing |
$45,295 |
13.8% |
48.8% |
4.2% |
41.6% |
3.4% |
22.5% |
40.7% |
10.2% |
26.5% |
25.0% |
12.6% |
20.3% |
| Ohio |
10 |
Non-Conformist |
$46,703 |
8.9% |
77.7% |
16.3% |
2.1% |
2.2% |
4.2% |
5.8% |
2.8% |
28.7% |
23.9% |
16.1% |
27.9% |
| Michigan |
6 |
Left Behind |
$47,498 |
8.6% |
84.2% |
7.8% |
4.5% |
1.6% |
4.4% |
7.0% |
3.3% |
30.8% |
23.8% |
16.1% |
26.1% |
| Arizona |
2 |
Diverse, Fast-Growing |
$47,507 |
8.8% |
67.0% |
3.9% |
23.5% |
3.0% |
11.1% |
22.1% |
3.9% |
21.5% |
27.2% |
18.8% |
32.4% |
| Arizona |
1 |
Diverse, Fast-Growing |
$47,531 |
11.9% |
54.8% |
2.3% |
18.8% |
1.7% |
6.4% |
27.6% |
5.9% |
27.0% |
26.0% |
14.3% |
23.5% |
| Illinois |
13 |
Left Behind |
$48,127 |
8.2% |
81.6% |
10.0% |
2.8% |
3.9% |
5.1% |
7.3% |
2.6% |
31.3% |
22.3% |
17.8% |
29.6% |
| Pennsylvania |
17 |
Left Behind |
$48,600 |
8.7% |
85.9% |
5.4% |
6.3% |
1.7% |
5.7% |
9.3% |
3.3% |
40.8% |
18.2% |
13.3% |
20.6% |
| Wisconsin |
3 |
Left Behind |
$49,851 |
5.7% |
94.0% |
1.0% |
1.8% |
1.8% |
2.4% |
5.8% |
3.1% |
35.0% |
21.4% |
15.6% |
23.7% |
| Texas |
23 |
Diverse, Fast-Growing |
$50,003 |
7.8% |
28.0% |
3.2% |
66.6% |
1.4% |
17.0% |
55.5% |
14.6% |
26.4% |
20.6% |
13.7% |
21.1% |
| Minnesota |
8 |
Left Behind |
$50,464 |
6.6% |
93.7% |
0.9% |
1.2% |
0.7% |
1.7% |
3.4% |
2.2% |
33.7% |
24.8% |
15.1% |
22.2% |
| Arizona |
9 |
Diverse, Fast-Growing |
$50,832 |
7.5% |
62.4% |
5.1% |
23.3% |
5.1% |
14.5% |
26.1% |
5.3% |
19.8% |
24.3% |
22.5% |
36.0% |
| New York |
21 |
Left Behind |
$51,255 |
8.5% |
91.2% |
3.3% |
2.9% |
0.9% |
3.5% |
5.7% |
3.5% |
35.8% |
19.2% |
12.4% |
22.3% |
| Iowa |
2 |
Left Behind |
$51,261 |
5.2% |
88.9% |
3.3% |
4.2% |
2.3% |
4.6% |
7.6% |
3.4% |
32.3% |
21.2% |
17.3% |
27.2% |
| Michigan |
9 |
Left Behind |
$51,550 |
9.3% |
82.0% |
10.5% |
1.8% |
3.8% |
10.9% |
13.2% |
3.6% |
28.3% |
23.1% |
17.6% |
28.7% |
| Ohio |
1 |
Non-Conformist |
$52,272 |
9.1% |
72.8% |
20.5% |
2.3% |
2.8% |
5.3% |
7.3% |
2.9% |
29.2% |
19.5% |
20.3% |
32.4% |
| New York |
24 |
Left Behind |
$53,034 |
7.5% |
85.1% |
7.4% |
3.4% |
2.4% |
5.7% |
8.5% |
3.0% |
29.7% |
18.3% |
16.6% |
29.4% |
| Nevada |
4 |
Diverse, Fast-Growing |
$53,073 |
11.3% |
51.7% |
14.0% |
24.4% |
6.0% |
15.9% |
27.7% |
6.0% |
30.3% |
26.5% |
12.7% |
19.4% |
| Iowa |
1 |
Left Behind |
$54,028 |
4.9% |
91.7% |
2.9% |
2.7% |
1.3% |
3.3% |
5.5% |
3.2% |
34.2% |
21.3% |
17.1% |
25.1% |
| California |
10 |
Diverse, Fast-Growing |
$54,111 |
14.2% |
49.5% |
3.2% |
36.8% |
6.9% |
20.3% |
38.8% |
11.2% |
28.5% |
25.0% |
11.9% |
17.3% |
| Oregon |
5 |
Left Behind |
$54,112 |
9.5% |
80.3% |
0.9% |
12.5% |
2.8% |
10.1% |
17.3% |
4.7% |
25.2% |
27.1% |
18.4% |
28.7% |
| Pennsylvania |
16 |
Non-Conformist |
$54,296 |
8.0% |
77.1% |
6.2% |
14.4% |
1.8% |
7.2% |
19.0% |
7.1% |
37.1% |
15.2% |
16.1% |
24.9% |
| Washington |
3 |
Left Behind |
$54,685 |
9.2% |
84.8% |
1.4% |
6.7% |
3.3% |
8.2% |
12.1% |
3.2% |
27.4% |
28.8% |
15.1% |
23.3% |
| California |
3 |
Diverse, Fast-Growing |
$56,306 |
11.2% |
52.8% |
6.4% |
24.6% |
11.7% |
18.3% |
30.7% |
8.2% |
23.8% |
26.4% |
14.8% |
24.0% |
| New York |
19 |
Left Behind |
$57,566 |
8.5% |
87.1% |
4.4% |
5.9% |
1.6% |
6.4% |
9.3% |
3.1% |
32.0% |
18.5% |
14.7% |
27.2% |
| Nebraska |
2 |
Non-Conformist |
$58,344 |
5.3% |
77.6% |
9.2% |
8.6% |
2.9% |
8.3% |
13.0% |
4.3% |
21.7% |
23.7% |
24.6% |
37.6% |
| Pennsylvania |
15 |
Left Behind |
$58,384 |
7.4% |
80.4% |
4.3% |
12.1% |
2.6% |
7.6% |
16.2% |
4.1% |
35.6% |
16.3% |
16.7% |
27.8% |
| Iowa |
3 |
Left Behind |
$58,545 |
5.2% |
87.5% |
3.6% |
5.1% |
2.7% |
6.4% |
9.3% |
2.9% |
28.7% |
21.3% |
22.4% |
31.5% |
| New Jersey |
2 |
Non-Conformist |
$58,584 |
10.9% |
69.8% |
12.6% |
13.0% |
3.9% |
10.5% |
19.2% |
5.6% |
34.9% |
19.0% |
16.3% |
24.2% |
| Massachusetts |
9 |
Left Behind |
$62,099 |
8.0% |
89.4% |
2.7% |
3.8% |
1.3% |
9.1% |
13.7% |
5.2% |
28.2% |
19.1% |
20.1% |
32.7% |
| Nevada |
3 |
Diverse, Fast-Growing |
$63,360 |
8.5% |
61.9% |
6.7% |
14.4% |
13.5% |
18.0% |
24.6% |
2.7% |
25.0% |
26.9% |
20.8% |
31.6% |
| Michigan |
8 |
Thriving Suburban |
$63,541 |
7.6% |
84.8% |
5.2% |
4.0% |
4.1% |
7.1% |
8.9% |
1.7% |
22.2% |
23.7% |
22.9% |
38.7% |
| Texas |
32 |
Non-Conformist |
$63,573 |
6.6% |
55.5% |
11.7% |
22.6% |
8.0% |
20.6% |
32.6% |
7.2% |
17.8% |
20.0% |
26.7% |
42.1% |
| California |
7 |
Diverse, Fast-Growing |
$65,159 |
11.1% |
58.8% |
7.2% |
14.6% |
14.9% |
18.3% |
26.4% |
4.6% |
21.1% |
26.5% |
21.4% |
32.1% |
| New York |
11 |
Diverse, Fast-Growing |
$65,480 |
7.5% |
64.4% |
7.1% |
14.4% |
13.4% |
29.5% |
40.7% |
6.6% |
29.7% |
16.1% |
19.8% |
32.6% |
| New Hampshire |
2 |
Left Behind |
$65,822 |
5.7% |
92.6% |
1.1% |
2.6% |
2.4% |
5.6% |
7.8% |
2.5% |
29.4% |
18.7% |
21.2% |
34.5% |
| Kansas |
3 |
Thriving Suburban |
$66,525 |
5.8% |
76.0% |
8.5% |
9.6% |
4.1% |
9.7% |
14.1% |
3.4% |
19.1% |
20.8% |
28.7% |
44.9% |
| New Hampshire |
1 |
Left Behind |
$67,706 |
5.8% |
92.7% |
1.3% |
2.7% |
2.2% |
5.8% |
8.0% |
2.5% |
28.2% |
19.4% |
22.4% |
35.2% |
| Connecticut |
5 |
Thriving Suburban |
$67,805 |
8.5% |
74.6% |
6.3% |
14.5% |
3.4% |
13.6% |
24.2% |
5.1% |
28.6% |
17.6% |
19.7% |
34.8% |
| Colorado |
6 |
Thriving Suburban |
$69,909 |
6.7% |
66.3% |
8.8% |
16.8% |
5.6% |
14.7% |
22.5% |
3.9% |
19.9% |
22.6% |
26.8% |
40.9% |
| Connecticut |
2 |
Left Behind |
$71,458 |
7.7% |
84.6% |
4.0% |
6.5% |
3.1% |
7.0% |
11.7% |
2.7% |
30.0% |
19.3% |
18.9% |
33.7% |
| California |
25 |
Diverse, Fast-Growing |
$72,342 |
9.9% |
48.0% |
7.8% |
33.1% |
8.5% |
20.7% |
31.4% |
7.2% |
22.8% |
26.0% |
18.1% |
26.9% |
| New Jersey |
3 |
Non-Conformist |
$73,485 |
8.8% |
78.5% |
10.1% |
6.4% |
3.4% |
8.3% |
11.7% |
2.5% |
32.7% |
19.5% |
21.3% |
32.1% |
| Washington |
8 |
Non-Conformist |
$73,749 |
6.9% |
77.4% |
2.6% |
8.3% |
7.8% |
12.4% |
17.7% |
3.5% |
25.4% |
23.8% |
21.4% |
32.3% |
| Michigan |
11 |
Thriving Suburban |
$74,873 |
6.2% |
82.3% |
5.1% |
2.8% |
8.3% |
12.7% |
15.3% |
1.8% |
20.2% |
20.4% |
26.6% |
45.4% |
| California |
49 |
Thriving Suburban |
$74,916 |
7.1% |
64.9% |
2.8% |
22.8% |
6.9% |
17.1% |
25.3% |
5.5% |
16.7% |
21.2% |
25.6% |
41.7% |
| Pennsylvania |
6 |
Thriving Suburban |
$75,159 |
6.1% |
86.2% |
4.1% |
4.7% |
4.1% |
7.0% |
10.2% |
2.5% |
28.9% |
14.7% |
25.4% |
41.8% |
| Minnesota |
2 |
Thriving Suburban |
$75,564 |
4.9% |
85.9% |
3.6% |
4.5% |
4.3% |
7.8% |
10.6% |
2.0% |
23.8% |
21.7% |
26.2% |
37.5% |
| Pennsylvania |
8 |
Thriving Suburban |
$77,839 |
6.8% |
87.2% |
3.5% |
3.9% |
4.5% |
8.4% |
11.2% |
1.9% |
30.7% |
17.6% |
22.8% |
37.4% |
| New York |
18 |
Thriving Suburban |
$78,021 |
7.7% |
72.3% |
9.1% |
14.1% |
3.2% |
11.9% |
21.1% |
3.8% |
26.9% |
19.6% |
19.8% |
34.8% |
| Minnesota |
3 |
Thriving Suburban |
$79,517 |
4.9% |
82.9% |
5.9% |
3.2% |
6.5% |
10.9% |
13.7% |
1.8% |
18.4% |
20.7% |
31.3% |
47.0% |
| California |
39 |
Non-Conformist |
$79,814 |
8.0% |
34.8% |
2.3% |
30.0% |
30.8% |
32.9% |
48.2% |
6.2% |
18.4% |
21.8% |
26.5% |
39.6% |
| Pennsylvania |
7 |
Thriving Suburban |
$80,607 |
6.3% |
86.7% |
5.3% |
2.8% |
4.4% |
7.2% |
11.3% |
2.8% |
28.6% |
15.6% |
24.1% |
41.5% |
| California |
48 |
Non-Conformist |
$81,680 |
7.4% |
59.2% |
1.2% |
18.5% |
18.6% |
24.7% |
34.1% |
5.6% |
15.2% |
21.8% |
27.8% |
43.5% |
| New York |
1 |
Thriving Suburban |
$87,272 |
6.2% |
78.5% |
4.7% |
11.9% |
4.0% |
12.3% |
18.2% |
3.4% |
29.4% |
18.2% |
18.5% |
34.5% |
| New York |
2 |
Non-Conformist |
$88,543 |
6.6% |
66.5% |
9.5% |
20.2% |
3.1% |
17.2% |
24.9% |
5.7% |
32.3% |
18.2% |
17.0% |
28.6% |
| Illinois |
6 |
Thriving Suburban |
$91,507 |
6.3% |
80.1% |
2.6% |
8.1% |
8.4% |
14.4% |
19.9% |
2.4% |
17.5% |
19.1% |
30.4% |
50.5% |
| California |
45 |
Non-Conformist |
$92,378 |
6.4% |
55.7% |
1.8% |
17.0% |
22.9% |
28.2% |
36.9% |
3.5% |
13.2% |
19.6% |
31.9% |
52.2% |
| New Jersey |
5 |
Thriving Suburban |
$92,550 |
6.8% |
72.5% |
4.9% |
12.1% |
9.8% |
19.9% |
25.4% |
3.3% |
24.9% |
16.2% |
28.4% |
45.5% |
| New York |
4 |
Thriving Suburban |
$94,770 |
6.7% |
61.0% |
14.2% |
17.6% |
6.2% |
21.9% |
28.9% |
5.5% |
25.1% |
16.4% |
22.1% |
39.9% |
| New Jersey |
11 |
Thriving Suburban |
$100,923 |
6.6% |
76.7% |
3.7% |
9.3% |
9.3% |
17.6% |
23.1% |
2.6% |
23.2% |
14.2% |
30.6% |
51.2% |
| New York |
3 |
Thriving Suburban |
$101,806 |
6.0% |
72.3% |
3.2% |
9.2% |
14.0% |
21.8% |
28.9% |
4.0% |
20.5% |
13.8% |
27.2% |
51.1% |
| New Jersey |
7 |
Thriving Suburban |
$102,551 |
6.4% |
74.8% |
4.5% |
10.8% |
9.0% |
17.7% |
23.4% |
3.0% |
22.1% |
14.7% |
29.1% |
50.7% |
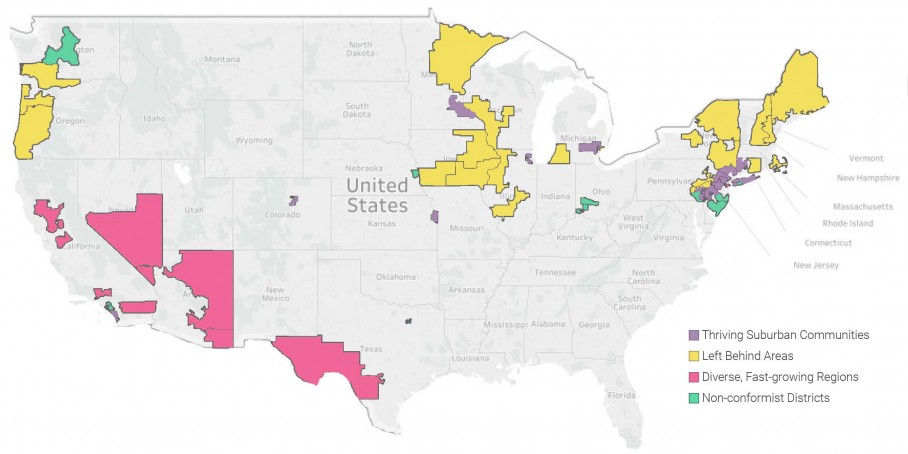
How Democrats can win the House majority By
Washington Post, James Hohmann June 2017
They divided the swing districts into four categories:-
- Thriving Suburban ,
- Left Behind ,
- Diverse/Fast-Growing , and
- Non-Conformist Districts.
The numbers underscore how different even the 23 GOP-held Clinton districts
are demographically:-
 | Many are suburban and overwhelmingly white. |
| Others are rural and heavily Latino. |
Within the broad categories, there are stark differences on :-
| income, |
| educational attainment and |
| employment rates. |
| Demographics:-
 | how many people moved into a district over the past year,
|
| what percentage of residents have access to broadband
Internet and |
| how many houses are vacant. |
|
More than half of adults in New Jersey’s 7th District, for example, graduated
from college. Only 17 percent in California’s 10th District did.
“The most important takeaway is that there is no one
kind of voter or district that can deliver the House for Democrats in
2018,” . “There’s been a lot of focus on suburban districts. There’s no doubt
that those are important, but there are not enough of them to win the House.”
Democrats still would not win the House even if they could get every single 2016
Clinton voter who backed a Republican House candidate to cross over and without
winning over Trump voters.
Moderate Democrats worry that the party will
squander precious pick-up opportunities in the midterms,
and even allow Trump to get reelected in 2020, by nominating
unelectable liberals.
Third Way believes Democrats must embrace ideological diversity to take back
legislative seats that were lost during the Obama era at the federal and state
level. “There are a lot of different kinds of candidates and policies we’re
going to have to welcome into the coalition to win,” Hatalsky said. “There’s no
single kind of candidate that would resonate in all these places. The idea that
we just need one kind of candidate – is not borne out by how different these
districts look.
We need to take a wider look at the kind of candidate
and agenda by District.
source
|